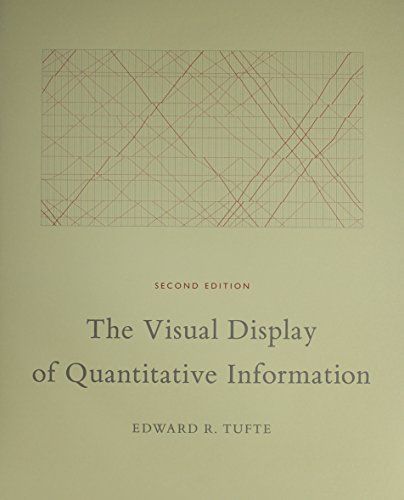
The Visual Display of Quantitative Information
Sophisticated
Educational
Timeless

The Visual Display of Quantitative Information

Graphical practice. Theory of data graphics.
Sign up to use

Reviews

Photo of Igor
Igor@bdsqqq
5 stars
Dec 10, 2024
Timeless
Educational
Photo of Miguel
Miguel @miguelenliteral
4 stars
Feb 23, 2023
Photo of Ketan Nayak
Ketan Nayak@ketan
3 stars
Oct 14, 2022
Photo of Jason Long
Jason Long@jasonlong
4 stars
Oct 3, 2022
Beautiful
Sophisticated
Photo of 里森
里森@lisson
5 stars
Oct 12, 2021
Convincing
Intelligent
Photo of John Manoogian III
John Manoogian III@jm3
3 stars
Apr 4, 2024
Photo of Alphan Günaydın
Alphan Günaydın@ialphan
4 stars
Feb 13, 2024
Photo of Jayme Cochrane
Jayme Cochrane@jamesco
5 stars
Dec 20, 2023
Photo of Dane Jensen
Dane Jensen@danejensen
5 stars
Dec 19, 2023
Photo of Michael Ernst
Michael Ernst@beingernst
5 stars
Dec 18, 2023
Photo of Jovan Lekovic
Jovan Lekovic@lekovicj
5 stars
Aug 10, 2023
Photo of Darius/Design
Darius/Design@dariusdesign
5 stars
Jul 6, 2023
Photo of Gabriel Ayuso
Gabriel Ayuso@gabrielayuso
4 stars
Jun 30, 2023
Photo of Mark
Mark@mrk
5 stars
Mar 15, 2023
Photo of Misha
Misha@yagudin
4 stars
Mar 9, 2023
Photo of Patricia lee
Patricia lee@plee
5 stars
Feb 11, 2023
Photo of Eva Decker
Eva Decker@evadecker
4 stars
Jan 4, 2023
Photo of Felipe Saldarriaga
Felipe Saldarriaga @felipesaldata
4 stars
Jan 3, 2023
Photo of Tanner Hodges
Tanner Hodges@tannerhodges
5 stars
Dec 4, 2022
Photo of Laura
Laura@lauragh
5 stars
Nov 1, 2022
Photo of Laura
Laura@lauragh
5 stars
Nov 1, 2022
Photo of Ketan Nayak
Ketan Nayak@ketan
3 stars
Oct 14, 2022
Photo of Tiffany
Tiffany@scientiffic
4 stars
Sep 26, 2022
Photo of Daniel Lauzon
Daniel Lauzon@daneroo
5 stars
Sep 5, 2022

Highlights

Photo of Chip Scanu
Chip Scanu@chipscanu